
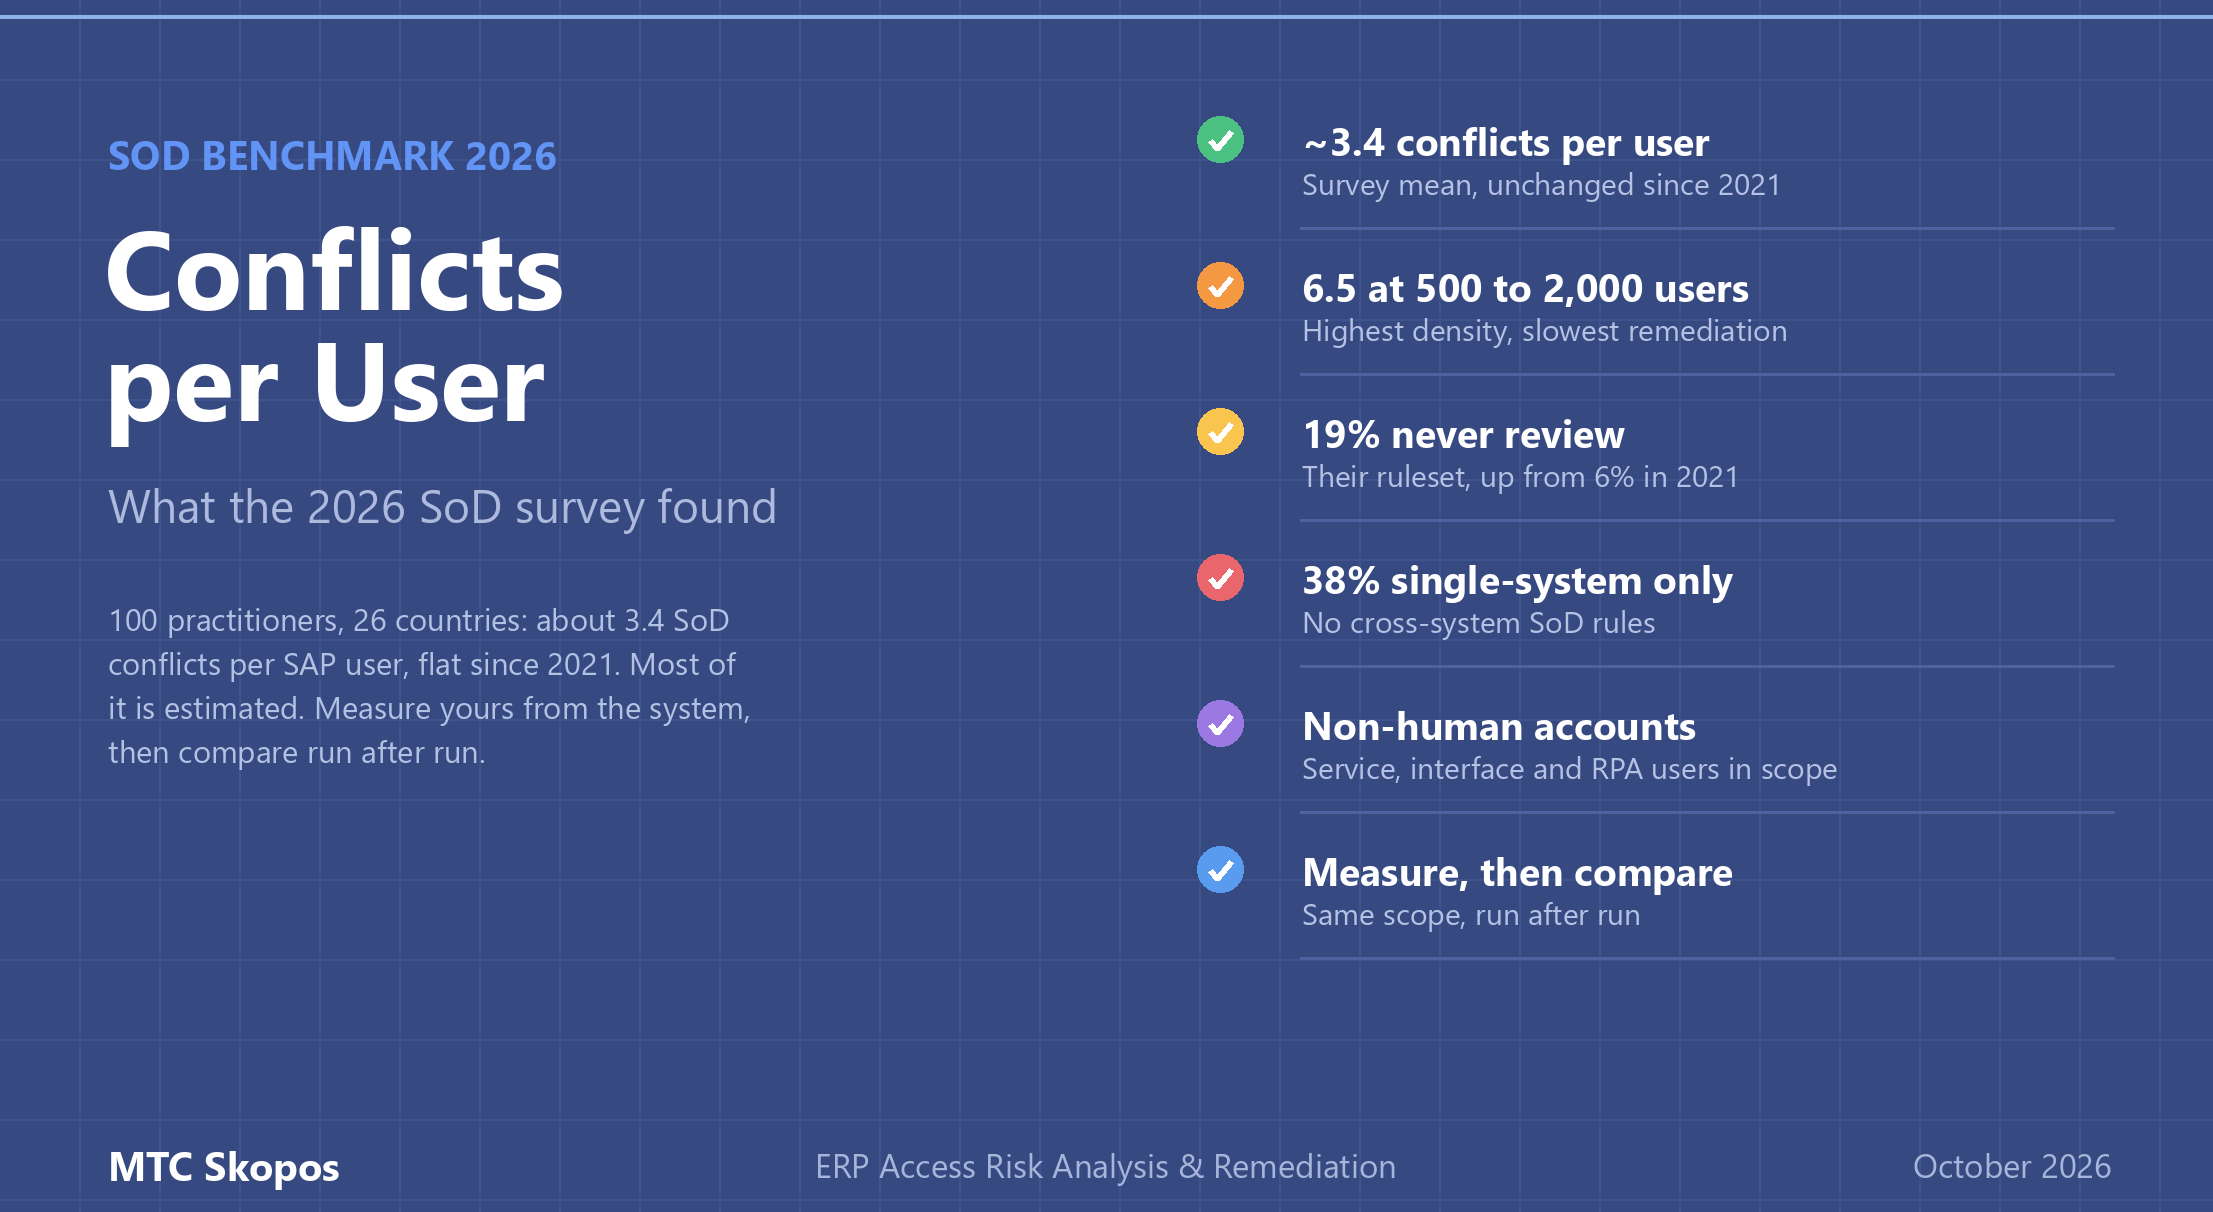
Five years of SoD programmes, and the conflicts per user did not move
The 2026 global SoD survey found about 3.4 SoD conflict combinations per SAP user, statistically unchanged from 2021, with 19% of organisations never reviewing their ruleset and 38% running no cross-system rules. Most of those numbers are practitioner estimates, and 14% of respondents could not estimate at all. MTC Skopos replaces the estimate with a measurement taken from the system itself: a full 10,000-user analysis runs in under 2 minutes on a standard laptop, every run writes a signed log of exactly what was analyzed, and licensing is a flat €5,736/year.
The survey is Segregation of Duties Risk Management in SAP Environments: 2026 Global Survey Report by Tiede-Jan de Jong (Accenture), fielded through the SAP Secure Together community in September and October 2026. It combines 100 core responses from 26 countries, a 56-respondent deep-dive module on non-human identities and AI agents, and a 2021 baseline of 83 responses. Figures below are quoted from it with attribution, as its CC BY-ND licence allows.
Its conclusion is one we agree with: better tools gave organisations better analysis, not better outcomes. Ownership, remediation discipline and policy adherence are decisions, not software features. What a tool can change is the cost of knowing where you stand, and that is where most of the gaps in the report start.
What did the 2026 SoD survey find?
| Indicator | 2021 | 2026 |
|---|---|---|
| Estimated conflict combinations per user (mean) | ~2.9 | ~3.4 |
| Never review the ruleset | 6% | 19% |
| Frequent false positives | 51% | 20% |
| Mitigation defined for all high and very-high risks | 66% | 65% |
| SoD policy consistently followed | 49% | 49% |
| No formal SoD policy | ~2% | 16% |
| Reported use of SAP GRC Access Control | 80% | ~55% |
| Reported use of SAP IAG / third-party platforms | 2% / 2% | 22% / 28% |
Source: de Jong, 2026. Tooling figures are directional: the 2026 question allowed several platforms per respondent.
False positives fell sharply as rulesets matured. The share of organisations running fewer than 100 risks dropped from 35% to 7%, and the average ruleset now holds about 317 SoD and critical access risks. Everything that measures an outcome rather than an input stayed flat.
What is the SoD conflicts-per-user ratio?
It is the number of conflict combinations divided by the number of named users. One user holding one risk counts once, so a user with three SoD risks contributes three. The survey uses it as its headline outcome metric because it normalises for size: 5,000 conflicts mean something different in a 2,000-user system than in a 40,000-user one.
| Organisation size (named users) | Mean conflicts per user | Median | Respondents |
|---|---|---|---|
| Fewer than 500 | 35.0 | 25.0 | 4 |
| 500 to 2,000 | 6.5 | 8.0 | 11 |
| 2,001 to 5,000 | 2.0 | 0.7 | 27 |
| 5,001 to 20,000 | 0.7 | 0.8 | 32 |
| More than 20,000 | 0.3 | 0.1 | 12 |
| All respondents | 3.4 | 0.8 | 86 |
Source: de Jong, 2026, section 3.2. Conflict volumes were answered as ranges and converted with upper-bound estimates.
Two cautions come with these numbers, and the report states both. They are self-reported, and the author's own practitioner note says direct analysis of authorization objects "regularly shows 5 to 6 or more" where practitioners cite 3 or 4. And the ratio is only comparable over time if the scope behind it stays the same: same ruleset, same user types, same systems.
How do you measure conflicts per user from your own system?
The first action the report recommends for the next 90 days is to calculate this ratio and write it down. With table exports and an analyzer, that takes an afternoon:
- Export the authorization tables.
USR02,AGR_USERS,AGR_1251,AGR_1252,AGR_AGRSandAGR_DEFINE, plusUST04/UST12if profiles are assigned directly. Manual export takes 5 to 10 minutes, RFC extraction 1 to 5 minutes. Nothing is installed in SAP. - Run a users analysis on the whole population against your ruleset. A typical 2,500-user system analyzes in under 10 seconds*, a 10,000-user system in under 2 minutes.
- Read the two counters on the Overview dashboard: total conflicts and users in scope. Divide the first by the second. The third counter, users with at least one conflict, tells you whether the ratio is spread thin or concentrated on a few accounts.
- Keep the signed execution log. It records the criteria, the user types in scope, the ruleset checksum and a checksum of every table analyzed. Next quarter, a ratio is only comparable to this one if those match, and the comparison view checks that for you.
* Benchmark: 150+ high and critical SoD risks in scope.
Decide the user-type question deliberately. Including System and Communication users usually raises the ratio, because technical accounts tend to hold broad access. Report both figures rather than picking the flattering one.
How do you track the ratio over time?
Load up to ten past analyses into the comparison view. Each one carries its users analyzed, users at risk and total conflicts, so the ratio becomes a trend rather than a single snapshot. Every user and risk pair is classified against the baseline as New, Resolved, Persisting or Intermittent (absent at both ends but raised in between), with per-risk and per-user deltas and, for any pair, the system, function and action that granted it in each run.
The comparison also refuses to let you fool yourself. It warns when the analyses used different rulesets, when the same ruleset was edited between runs (its checksum changed), when the data source, systems or criteria differ, or when only some runs include a simulation. A ratio that fell because someone narrowed the scope or quietly dropped a rule shows up as exactly that.
Which survey gaps can an analysis tool close?
| Gap in the survey | Survey figure | What closes it | In MTC Skopos |
|---|---|---|---|
| Conflict count unknown | 14% cannot estimate | A measured baseline | Users analysis, Overview counters |
| Ruleset never reviewed | 19% never; 30% have a documented procedure | A ruleset you can open, version and re-test cheaply | Ruleset maintained in Excel and owned by you; checksum of the version used recorded in every signed log |
| Conflicts built into roles | 71% (2025 survey) | Analyze roles independently of assignments | Roles analysis; role changes tested before build with the Simulation add-on |
| Mitigation instead of remediation | 40% cite it as a root cause | Concrete removal steps, with evidence the access is unused | Remediation add-on (least-disruption role changes); Did-Do add-on (usage plus CDHDR/CDPOS) |
| Risk acceptance passed off as a control | 43% cite control quality as a major challenge | See which conflicts are covered, and by what kind of control | Mitigation controls recorded per user and risk with a control type and ID; the Overview splits conflicts into mitigated and unmitigated, and by control type |
| No prioritization across thousands of conflicts | 21% have a formal scoring method | Know which risks and users drive the volume | Dashboard and remediation views rank risks by the number of times they are triggered and users by conflict count |
| Progress cannot be shown | Conflicts per user flat for five years | The same scope measured twice, with the differences explained | Comparison of up to ten analyses: new, resolved and persisting conflicts, with warnings when the ruleset or scope changed |
| Analysis cannot be evidenced | 28% audited on undocumented controls | Reproducible, tamper-evident record of each run | Ed25519-signed execution log, optional dual signature with your own key |
| Non-human accounts excluded | 38% excluded without controls or never assessed | Same ruleset applied to technical accounts | Analysis on any user type: Dialog, System, Communication, Service |
| No cross-system rules | 38% single system only; 13% reach non-SAP | Rules whose functions sit in different systems | Cross-System add-on with identity mapping across SAP and non-SAP sources |
| Detective-only analysis | 16% | Check access before it is granted | Single-user check under 1 second; a planned assignment tested before it is made with the Simulation add-on |
| S/4HANA Public Cloud | Often forces a switch to SAP Cloud IAG | An analyzer that reads the cloud access model | Public Cloud tenants analyzed on IAM apps and restrictions |
The ruleset row deserves a sentence of its own. A review nobody can reproduce is, as the report puts it, a review that cannot be audited. A ruleset kept as a spreadsheet, named with its version, and re-run in minutes after each change turns "we reviewed it" into a before-and-after comparison anyone can repeat. The report's own checklist asks whether every rule built on S_TABU_DIS (table access by authorization group) has a mirror on S_TABU_NAM (access by table name). In MTC Skopos an action is a free-text permission group rather than a transaction code, so one function can hold both variants for the same transaction, and either path raises the risk. In SAP GRC an action is a transaction code, so the second path usually ends up in a separate function, or not at all. MTC Skopos includes a template ruleset with 350+ SoD risks, 700+ critical access checks and 100+ authorization quality checks as a starting point, but the ruleset is yours to review, tune and maintain. See ruleset maintenance.
Why is the mid-size segment the one to watch?
Organisations with 500 to 2,000 users average 6.5 conflicts per user, more than three times the next band, and they are the slowest to remediate. The report describes them as "complex enough to generate substantial conflicts, but without the automation and dedicated governance resources of large enterprises". Only 11 respondents sit in that band, so treat the figure as a signal rather than a benchmark.
That segment is also where enterprise GRC pricing fits worst. MTC Skopos costs €5,736/year for the base license with no per-user or per-system fee, so a 1,200-user company pays the same as a 40,000-user one. The add-ons that matter for a clean-up project, remediation (€2,398/year) and did-do (€1,678/year), are priced openly on the pricing page.
Frequently asked questions
What is the average number of SoD conflicts per user in SAP?
The 2026 SoD survey by Tiede-Jan de Jong (100 respondents, 26 countries) puts the mean at about 3.4 conflict combinations per named user and the median at about 0.8, against roughly 2.9 and 0.2 in 2021. Density falls with organisation size: about 6.5 per user at 500 to 2,000 users, 2.0 at 2,001 to 5,000, 0.7 at 5,001 to 20,000 and 0.3 above 20,000. These are self-reported range estimates, and the report itself notes that direct system analysis usually finds more.
How do you calculate SoD conflicts per user?
Divide the number of conflict combinations (one user holding one risk counts once) by the number of named users in scope. Run a users analysis against the full user population, take the total conflicts and the users-in-scope count, and record which user types, ruleset version and systems were included, otherwise next year's figure is not comparable. In MTC Skopos both numbers are counters on the Overview dashboard of every run.
Why has the number of SoD conflicts per user not improved?
The survey points to organisational causes more than technical ones: lack of business ownership (45% of respondents), relying on mitigation instead of remediation (40%), and lack of resources to remediate (39%). Roles that contain conflicts by design also keep regenerating them: in the companion 2025 survey, 71% said their roles themselves contain SoD conflicts.
Can MTC Skopos analyze non-human accounts such as service, system and RPA users?
Yes. The analysis runs on any SAP user type, Dialog, System, Communication or Service, so technical accounts are analyzed with the same ruleset as people, either together with them or separately so they do not dominate the critical access findings. An account that a bot or integration runs under is analyzed like any other user. MTC Skopos does not trace chains of actions across several identities through BTP or middleware.
Source: de Jong, T.-J. (2026). Segregation of Duties Risk Management in SAP Environments: 2026 Global Survey Report. SAP Secure Together Community. Licensed CC BY-ND 4.0.
Related reading: SAP Access Risk Analysis Tool · Ruleset maintenance · Multi-ERP SoD analysis · Did-Do analysis · SoD remediation white paper · 13 SAP SoD tools compared