
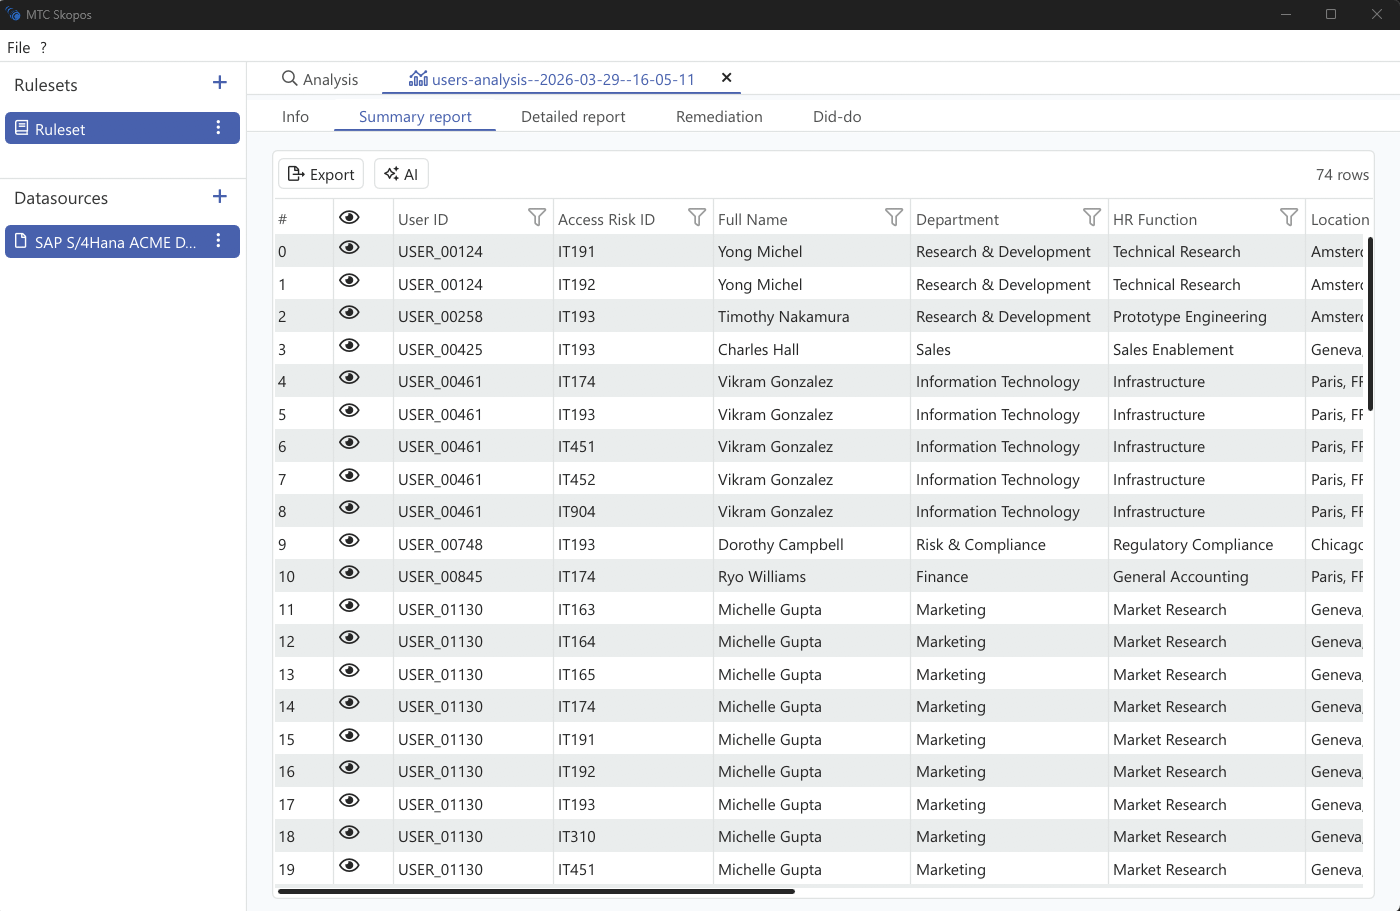
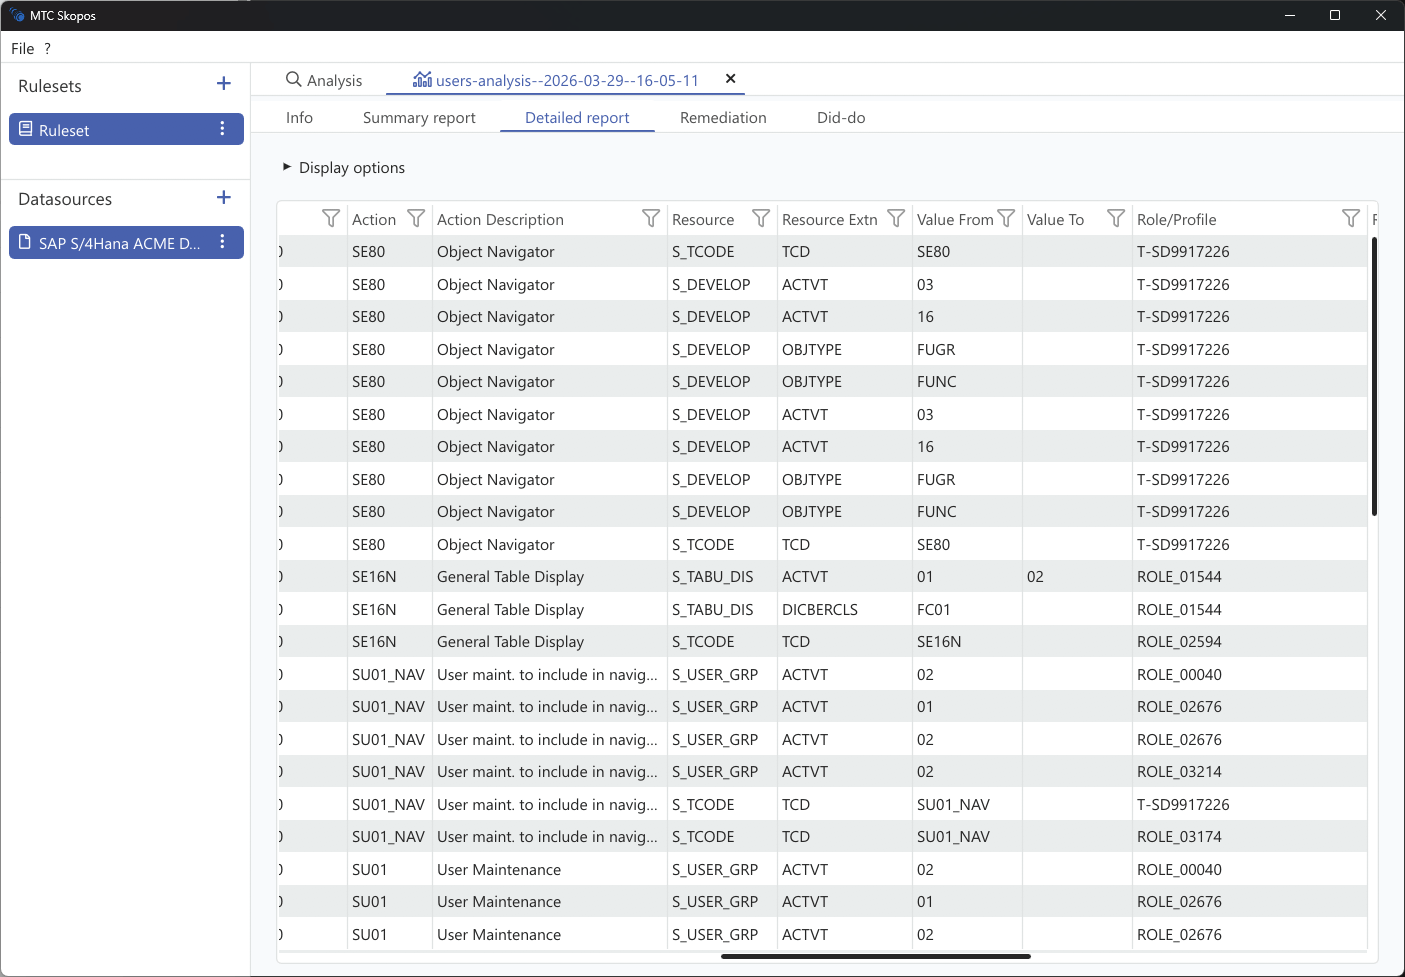
Results Table
Results are displayed in a table with the following information:
| Column | Description |
|---|---|
| User/Role | Affected user or role name |
| Risk ID | Risk identifier (e.g., F001) |
| Risk Description | Human-readable risk name |
| Risk Level | Severity as defined by the ruleset, commonly Critical, High, Medium, Low |
| Risk Type | Type as defined by the ruleset, commonly Segregation of Duties, Critical Action, Critical Permission |
| Function | Business function(s) involved |
| Action | Transaction codes providing the access |
| Role | Role(s) granting the access |
| Composite Role | Parent composite role (if applicable) |
| Business Process | Business process category |
| Department | HR department of the user, when HR data is loaded |
| HR Function | HR function of the user, when HR data is loaded |
| Location | HR location of the user, when HR data is loaded |
Every column has a filter, so a result can be narrowed further after the analysis has run. Scoping before the run is still preferable for large systems, because it keeps the analysis and the report small. See Scoping Your Analysis.
Risk level and risk type are not fixed lists. Both carry through verbatim from the loaded ruleset, and the filter options offered here are built from the distinct values found in it. Two reports produced against different rulesets are only comparable on severity if those rulesets agree on the vocabulary.
Result Tabs
| Tab | Content |
|---|---|
| Info | The criteria the analysis was run with |
| Overview | Interactive dashboard over the whole result set, see below |
| Summary report | One row per user and risk |
| Detailed report | The roles, actions and authorizations behind each conflict |
| Remediation | Recommendations for resolving the risks, see Generating Recommendations |
| Did-do | Execution data for the access involved, when Did do was enabled. See Did-Do Analysis |
The table on screen is a view onto the exported files. For the exact column layout of what gets written to disk, which differs between users and roles mode, see Report Types.
Overview Dashboard
The Overview tab is the executive summary of the analysis. It reports the whole result set at a glance, before you open any report or export anything.
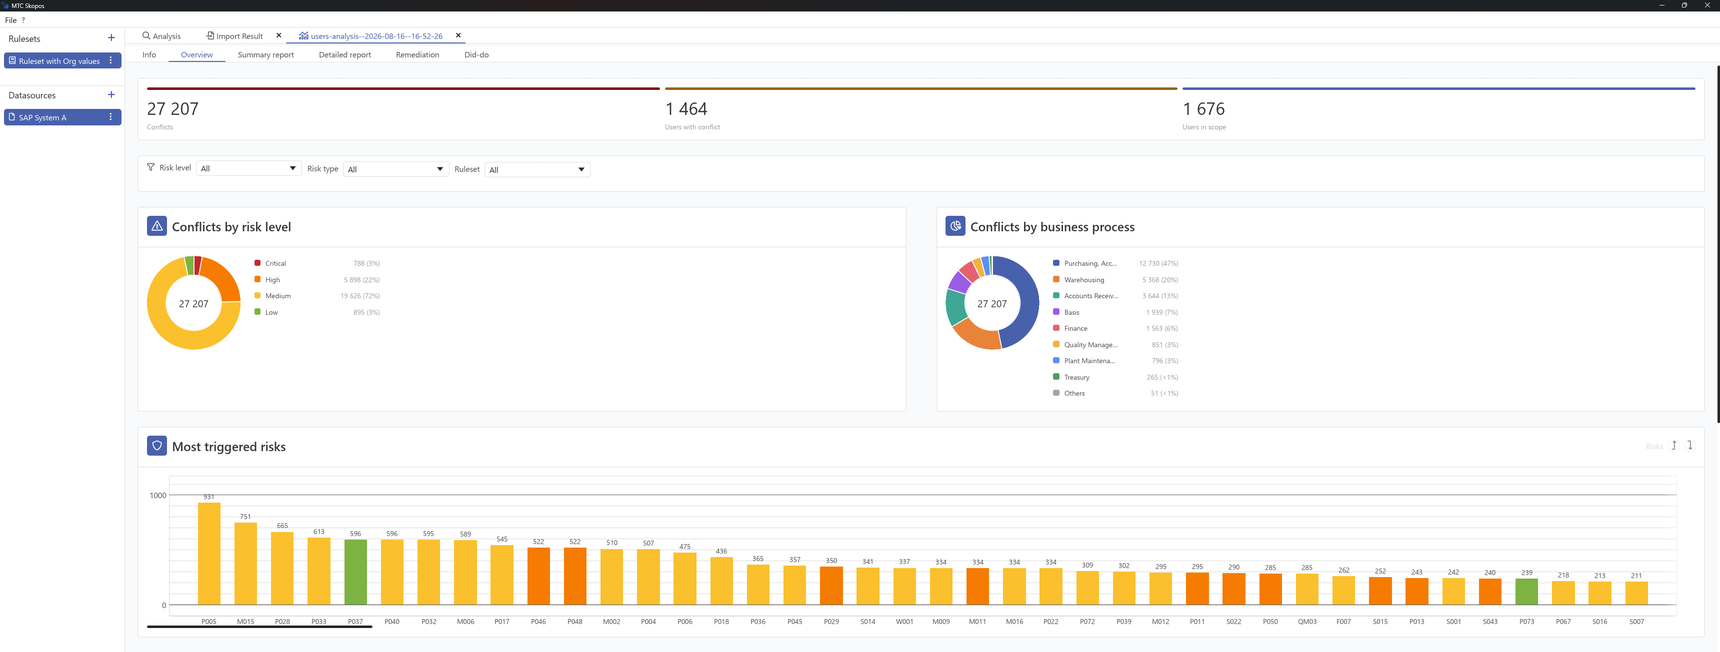
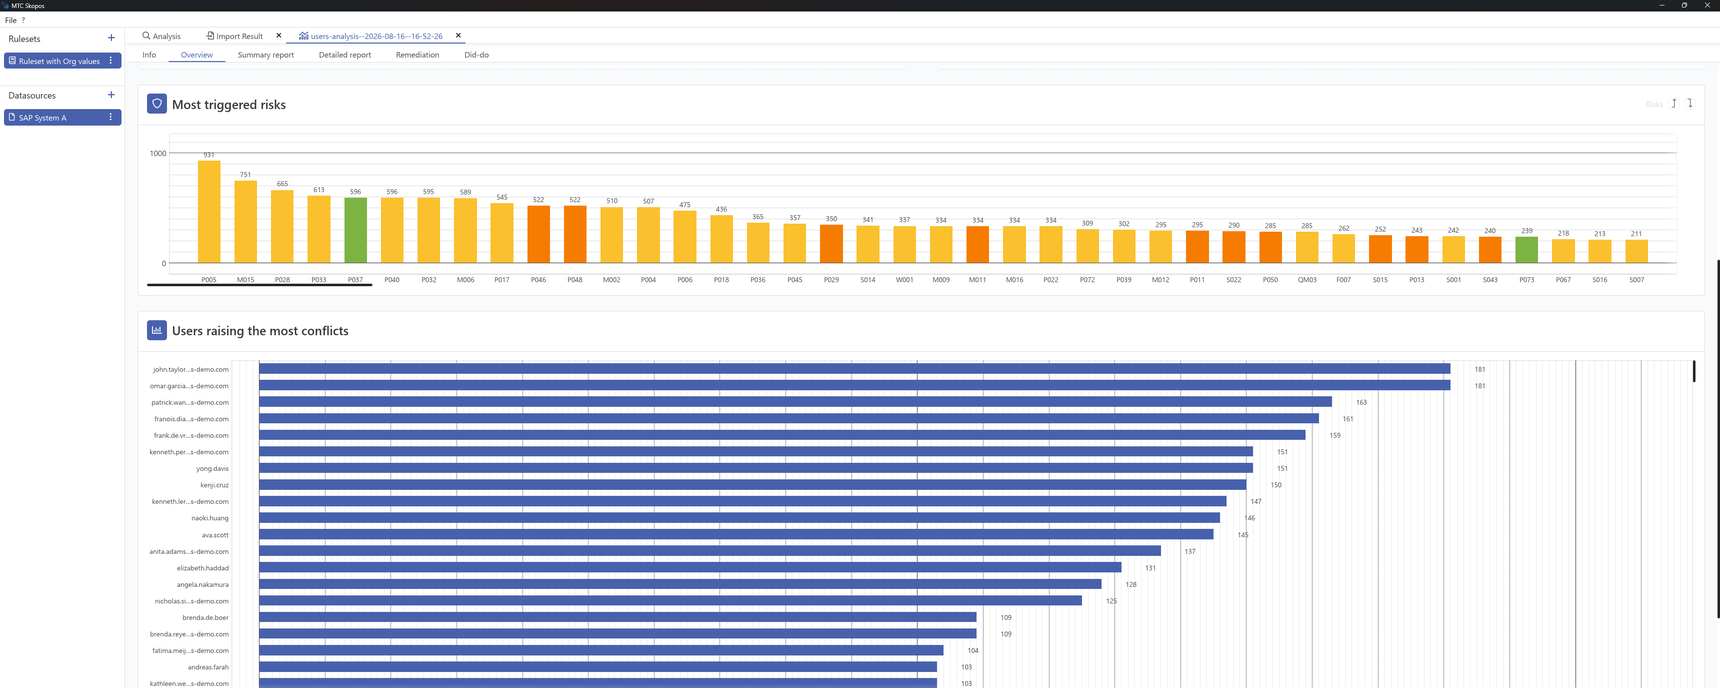
Three counters run across the top: total conflicts, users with at least one conflict, and users in scope. Below them:
| Panel | Content |
|---|---|
| Conflicts by risk level | Distribution across the severity values found in the loaded ruleset |
| Conflicts by business process | Distribution across the business processes the ruleset assigns to each risk |
| Most triggered risks | Risks ranked by conflict count, coloured by risk level |
| Users raising the most conflicts | Users ranked by conflict count |
The Risk level, Risk type and Ruleset selectors above the panels filter every panel at once. As with the result tables, the values offered come from the loaded ruleset rather than a fixed list.
Drilling down
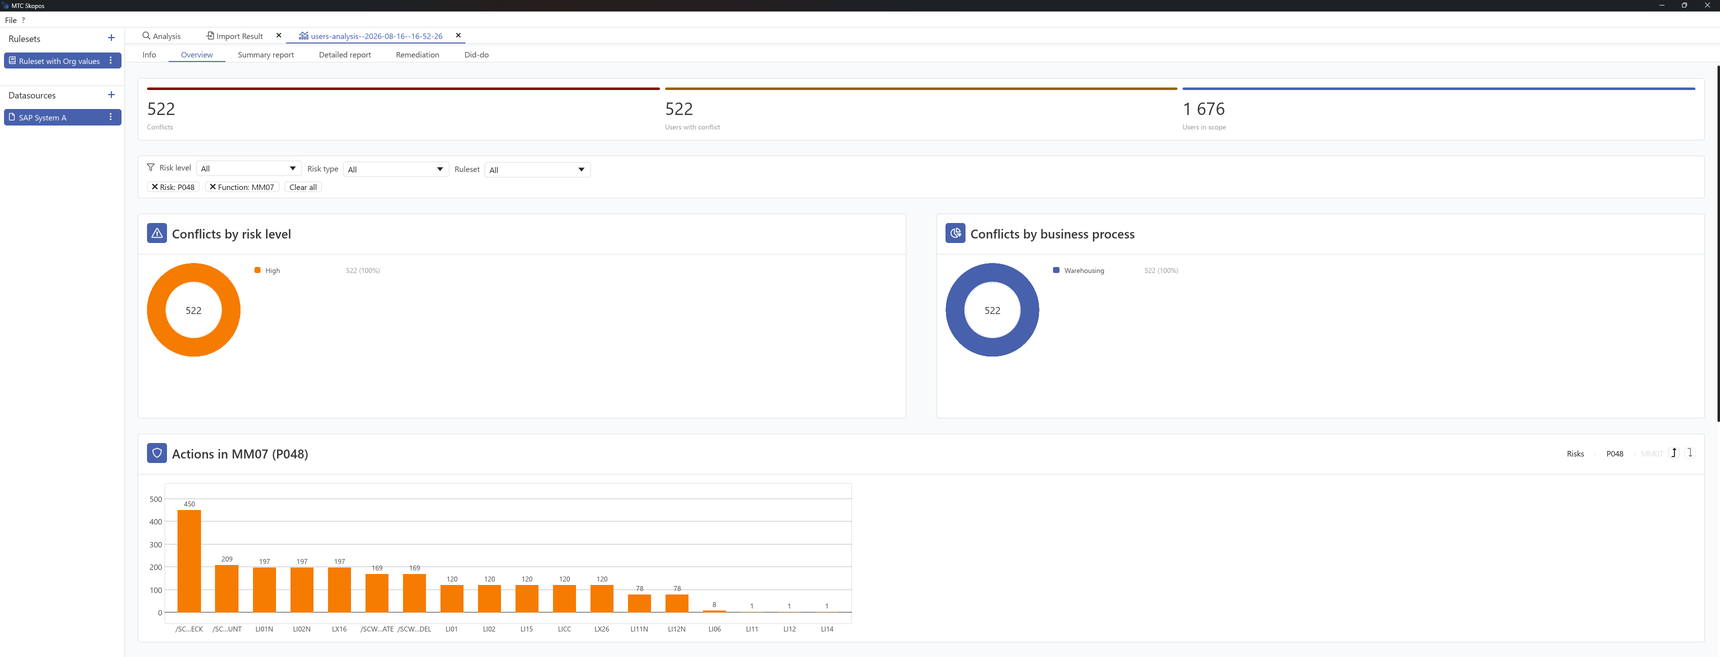
Clicking a bar in Most triggered risks applies that risk as a filter and replaces the chart with the functions inside it. Clicking a function again replaces it with the individual actions behind that function. Active filters appear as removable chips under the selectors, alongside a Clear all button, and a breadcrumb at the top right of the panel walks back up one level at a time.
This is how a risk with several hundred conflicts gets narrowed to the specific transactions driving it, without exporting anything.
The Overview reports on the run currently open and holds no history between runs. For deeper dashboarding, custom views, or trending across quarters, use the Power BI .pbix template or your own BI tool fed by exported results.