

SAP Access Risk Report: What to Include and How to Build One That Actually Helps
An access risk report documents the access-related risks identified in an ERP landscape: SoD violations, critical access, over-privileged users, and organizational scope breaches, plus the remediation each one needs. A good SAP access risk report answers three questions. Who holds risky access? What would go wrong if they used it? What should we fix first?
MTC Skopos covers both halves of that job. An interactive Overview dashboard gives you the executive summary of every analysis on the spot, and the same run exports structured risk models to Power BI, Tableau, or any BI platform for deeper dashboarding shaped around your own priorities. Base license from €5,736/year, with no per-user pricing.
Looking for the analysis engine, not the report deliverable? See the SAP Access Risk Analysis tool page for authorization-level SoD and critical access detection. This article focuses on what belongs in the report you produce from that analysis.
What belongs in a SAP access risk report
A credible SAP access risk report covers five categories of findings:
| Finding category | What it shows | Why it matters |
|---|---|---|
| SoD violations | Users who can perform two or more conflicting functions (e.g., create vendor + approve payment) | Fraud and error risk; SOX-relevant |
| Critical access | Users with access to sensitive transactions (SU01, SE38, SCC4, SM59) | Single-action high-damage risk |
| Over-privileged users | Users with access they never exercise, also known as privilege creep | Audit exposure; license cost; fraud surface |
| Organizational scope violations | Access crossing company codes, plants, or profit centers outside a user's scope | Internal control breakdown; data leakage |
| Did-do evidence | Which risks were actually executed vs which remained dormant | Separates theoretical from realized risk, which sets remediation order |
A report that covers only SoD violations misses the other four. Most commercial GRC reports do exactly that. MTC Skopos generates all five in a single pass.
Why we added a dashboard after saying we would not
For a long time this page argued that MTC Skopos should not ship a dashboard at all. The reasoning was that we are security consultants rather than a BI vendor, that every organization already owns Power BI or Tableau, and that a proprietary visualization layer is one more thing to get locked into.
Half of that still holds. The other half was wrong in practice.
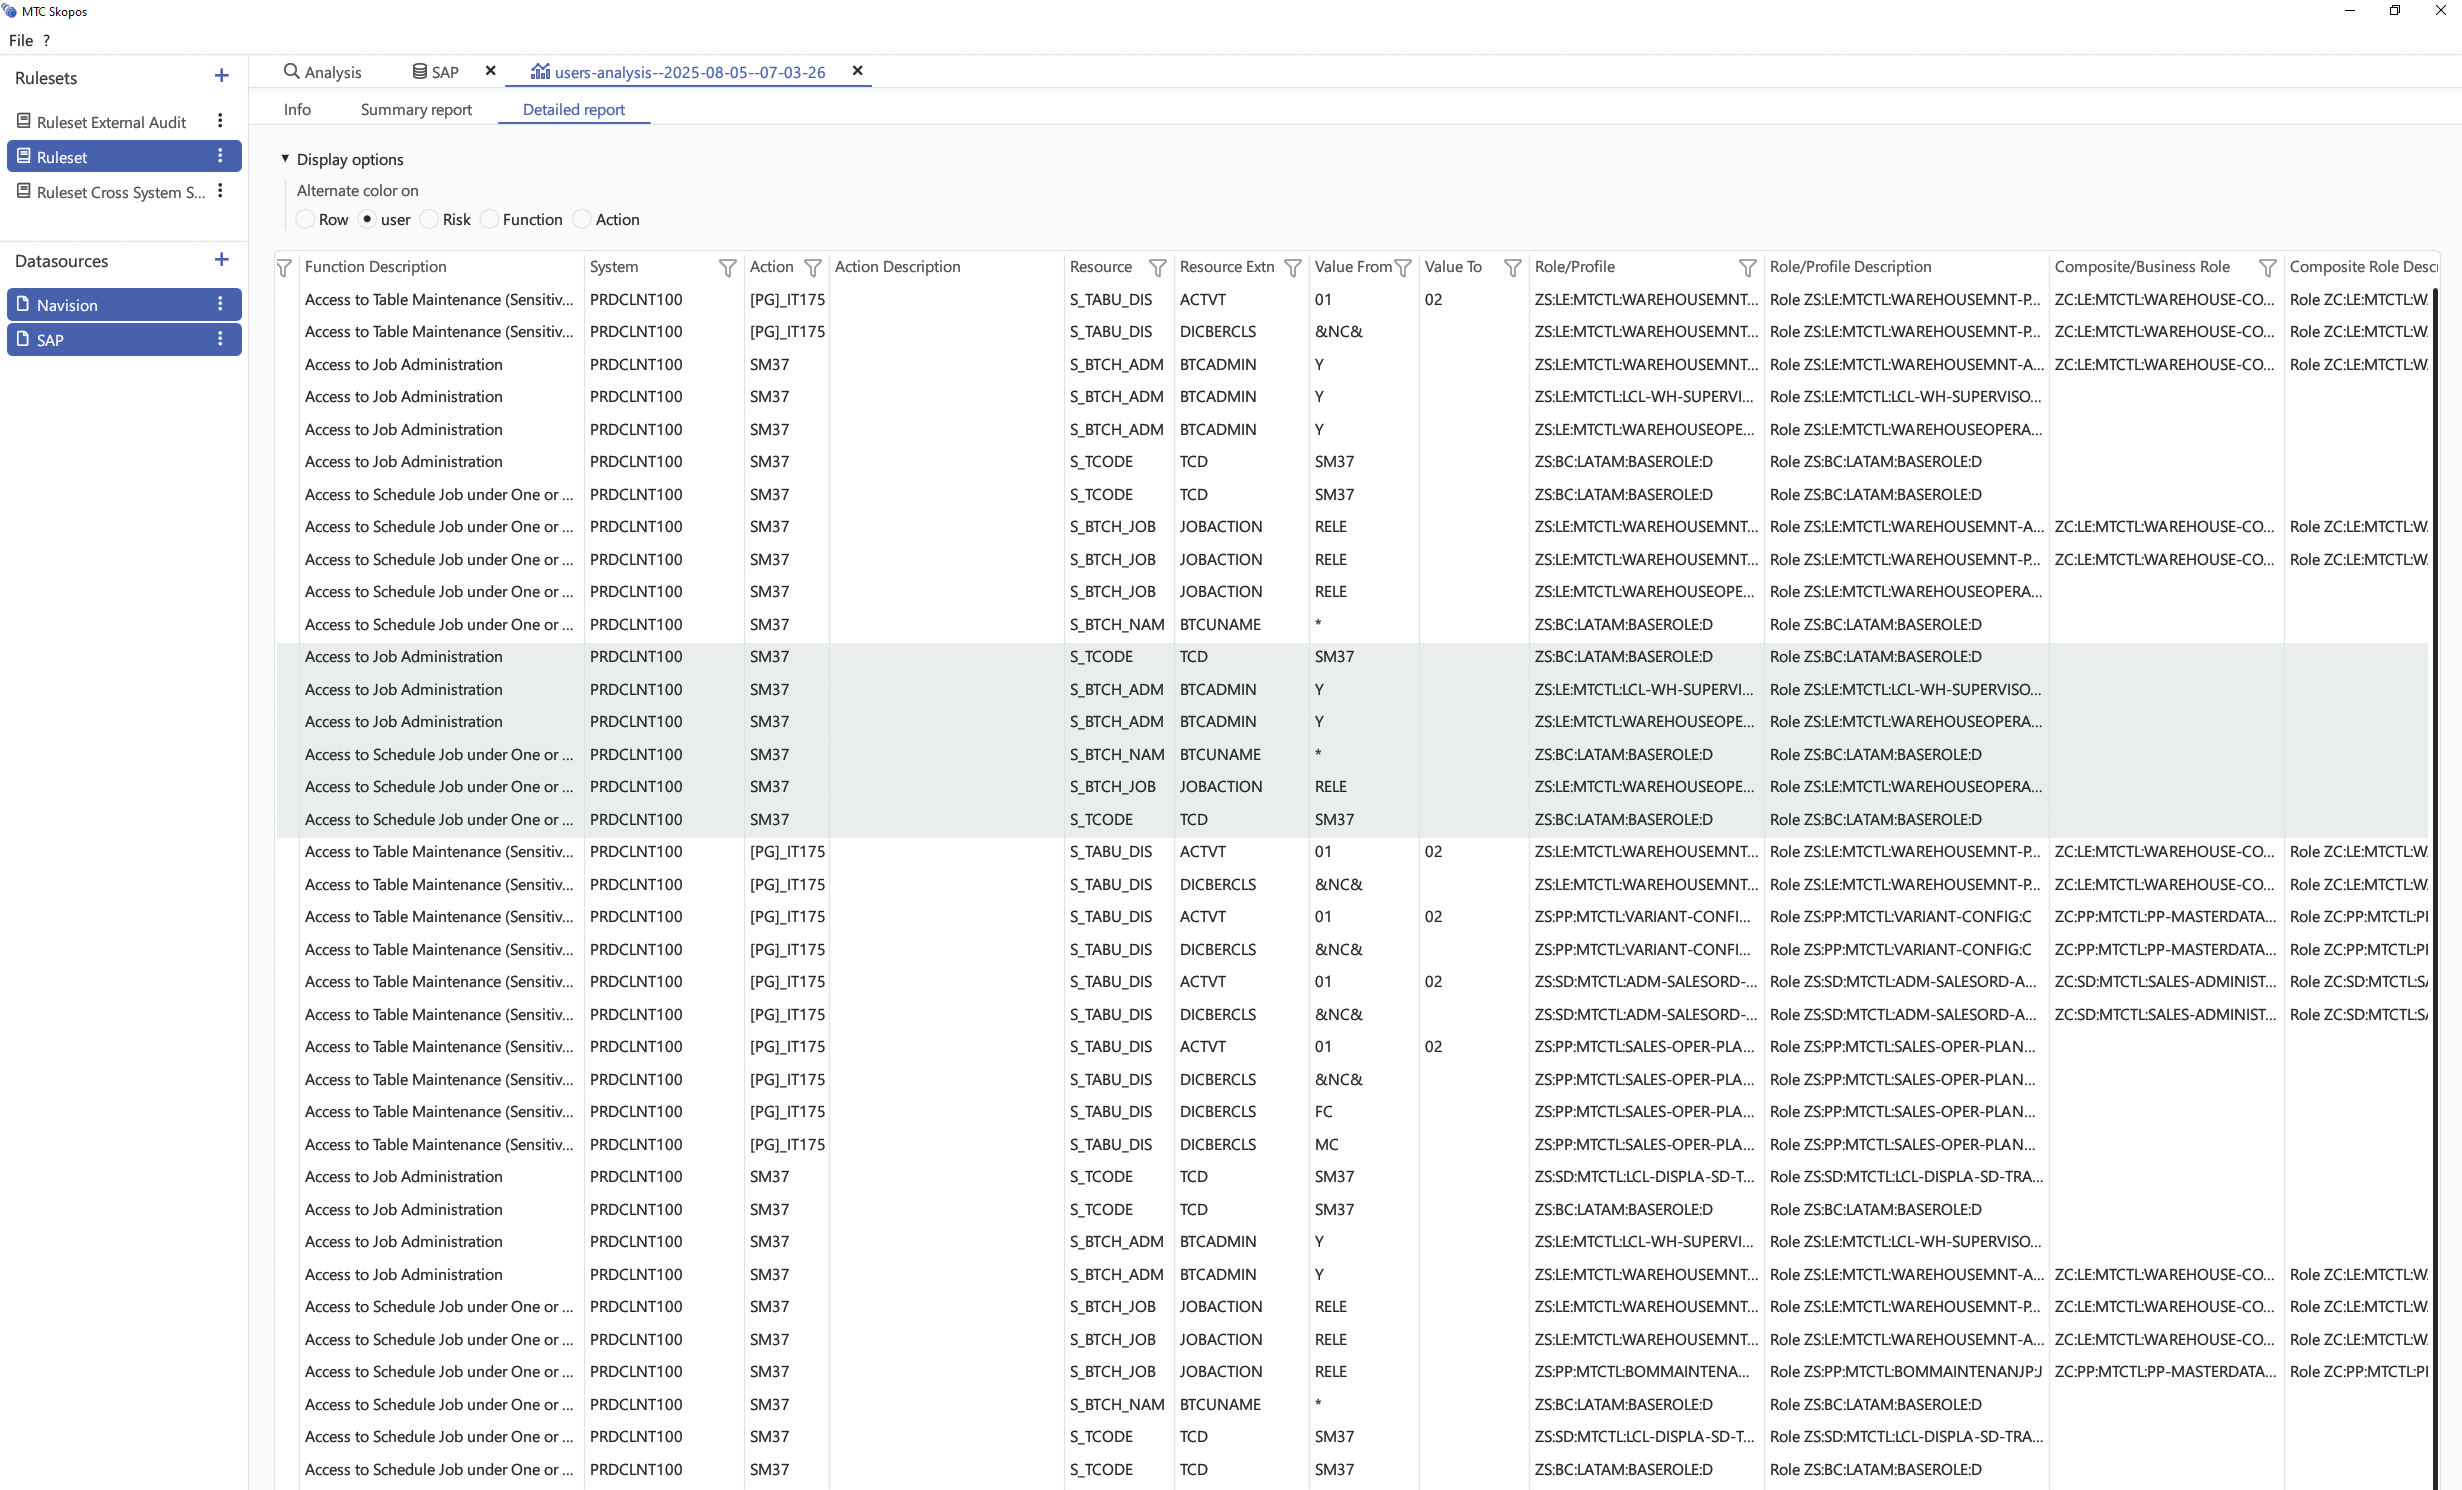
What we kept hearing from users was not "your charts are ugly". It was "I opened the analysis, I have 27,000 conflicts, what does this actually say?" Every engagement began the same way: export the results, open Power BI, refresh the model, and rebuild the same handful of headline numbers a stakeholder was going to ask for anyway. That summary was never the custom part. It should not have cost an export cycle.
So MTC Skopos now opens every analysis on an interactive Overview dashboard: the executive summary of the run, ready before you touch a BI tool. The .pbix template and the open exports are unchanged, and that is still where deeper dashboarding happens.
Executive summary in the tool, deeper dashboarding in Power BI
The distinction that matters is whether the view is the standard one or yours:
| What you are trying to do | Where it belongs | Why |
|---|---|---|
| Read the headline result of a run | Built-in Overview dashboard | Conflicts, users affected, and users in scope, before any export |
| See the shape of the risk landscape | Built-in Overview dashboard | Breakdowns by risk level and business process, ranked risks and users |
| Explain a number a stakeholder queries | Built-in Overview dashboard | Drill from a risk into its functions, then the actions behind them |
| Build views around your own priorities | Power BI .pbix | Materiality, audit perimeter, and mitigating controls are yours to define |
| Blend risk with HR, ticketing, or CMDB data | Power BI .pbix | Skopos never sees those systems; your BI platform already does |
| Track remediation progress over quarters | Power BI .pbix | Requires a history store, which a single desktop analysis does not keep |
The dashboard gives you the summary every analysis needs. Power BI gives you the report only your organization can specify.
What the built-in Overview dashboard shows
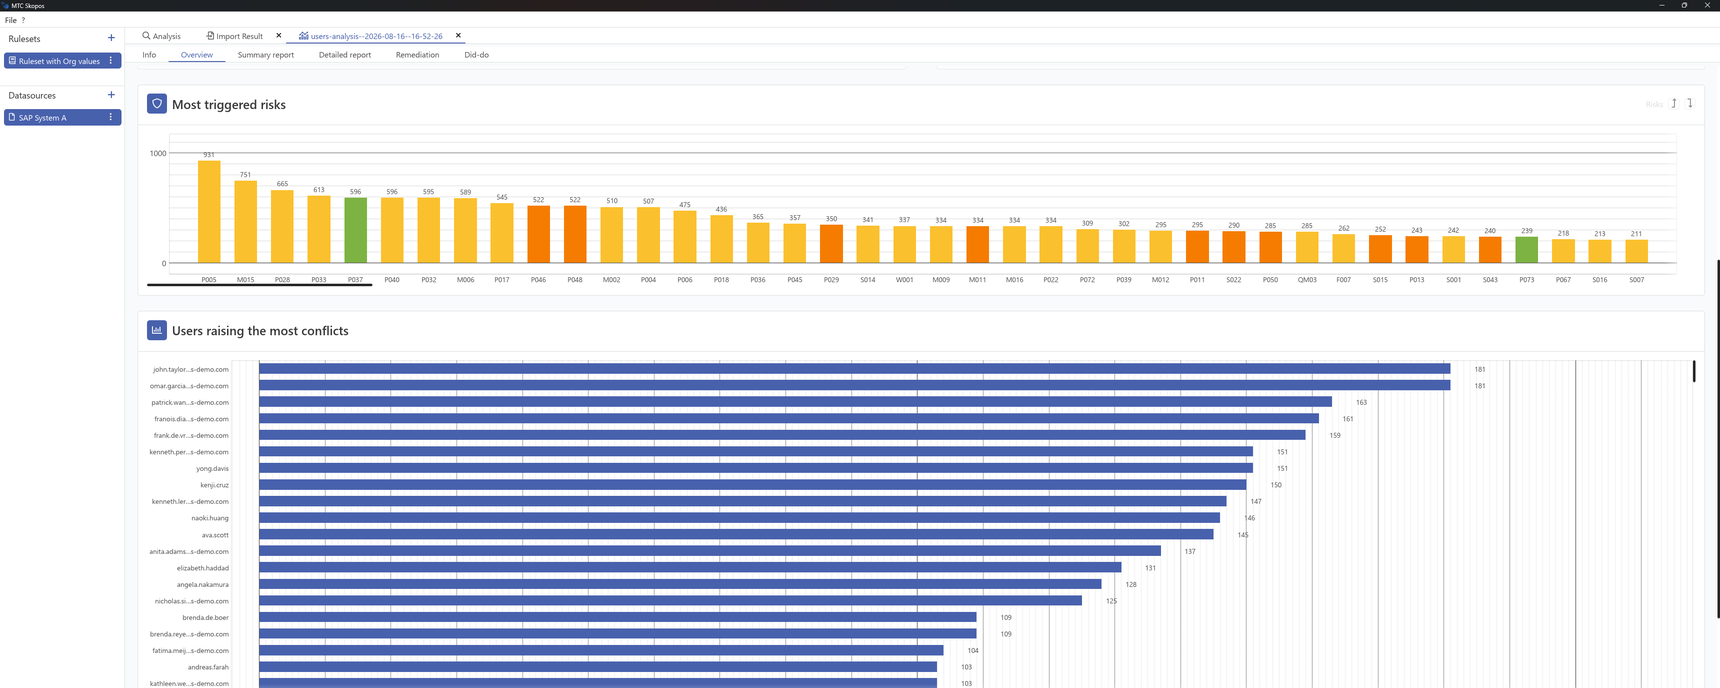
Every analysis opens on three counters (conflicts, users with a conflict, users in scope), then breaks the population down by risk level and by business process, ranks the most triggered risks, and ranks the users raising the most conflicts. Filters for risk level, risk type, and ruleset apply to the whole page at once.
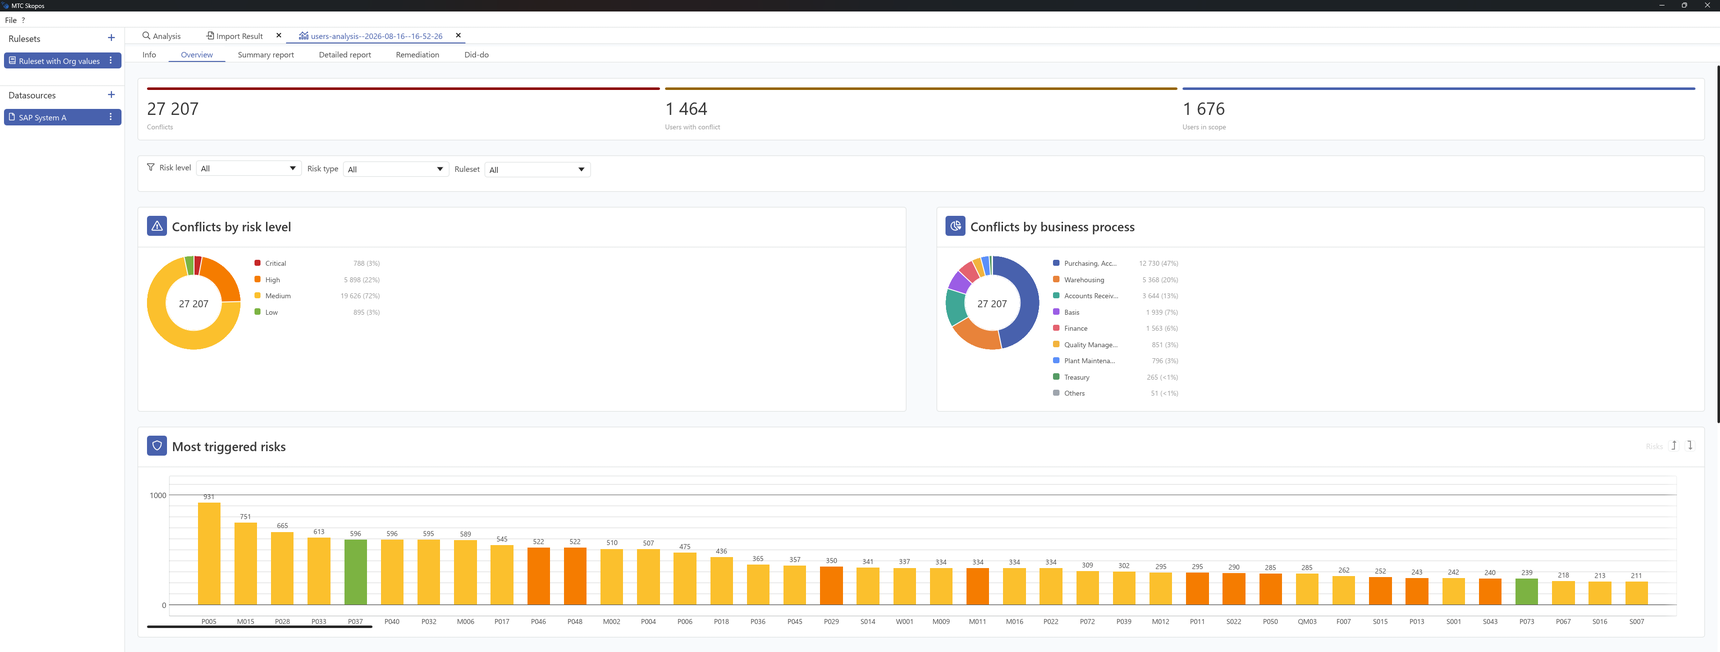
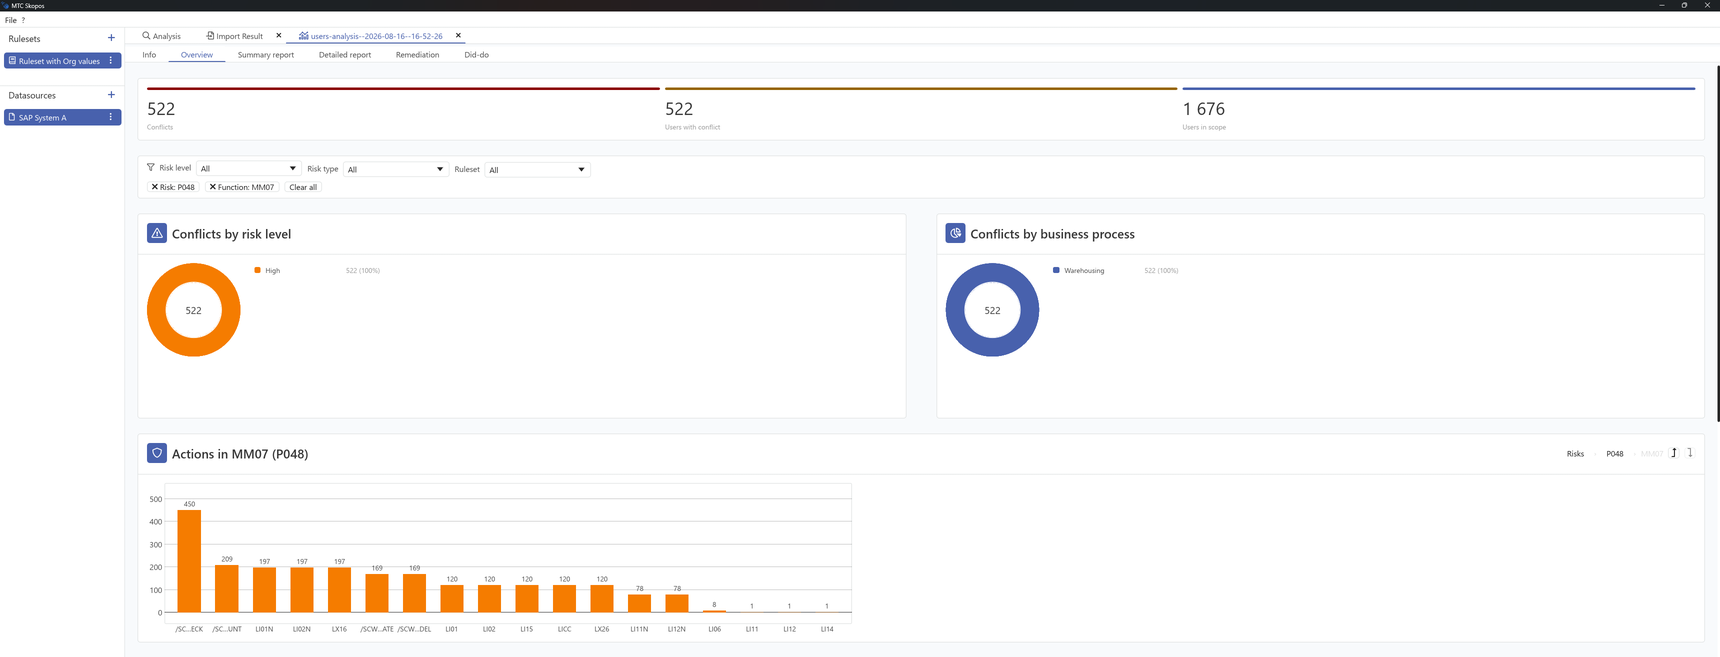
The point of the ranking charts is that they are not read-only. Clicking a bar in Most triggered risks filters the whole page to that risk and swaps the chart for the functions inside it. Clicking a function again swaps it for the individual actions. A breadcrumb in the corner walks you back out.
That is how a number like "522 conflicts on risk P048" turns into "450 of them come from /SC...ECK inside function MM07" without writing a query.
The dashboard sits alongside the reports it summarizes. From the same analysis you move into the summary report, the detailed report, remediation, and did-do analysis, all of which stay exportable.
Going deeper: your own dashboards in Power BI
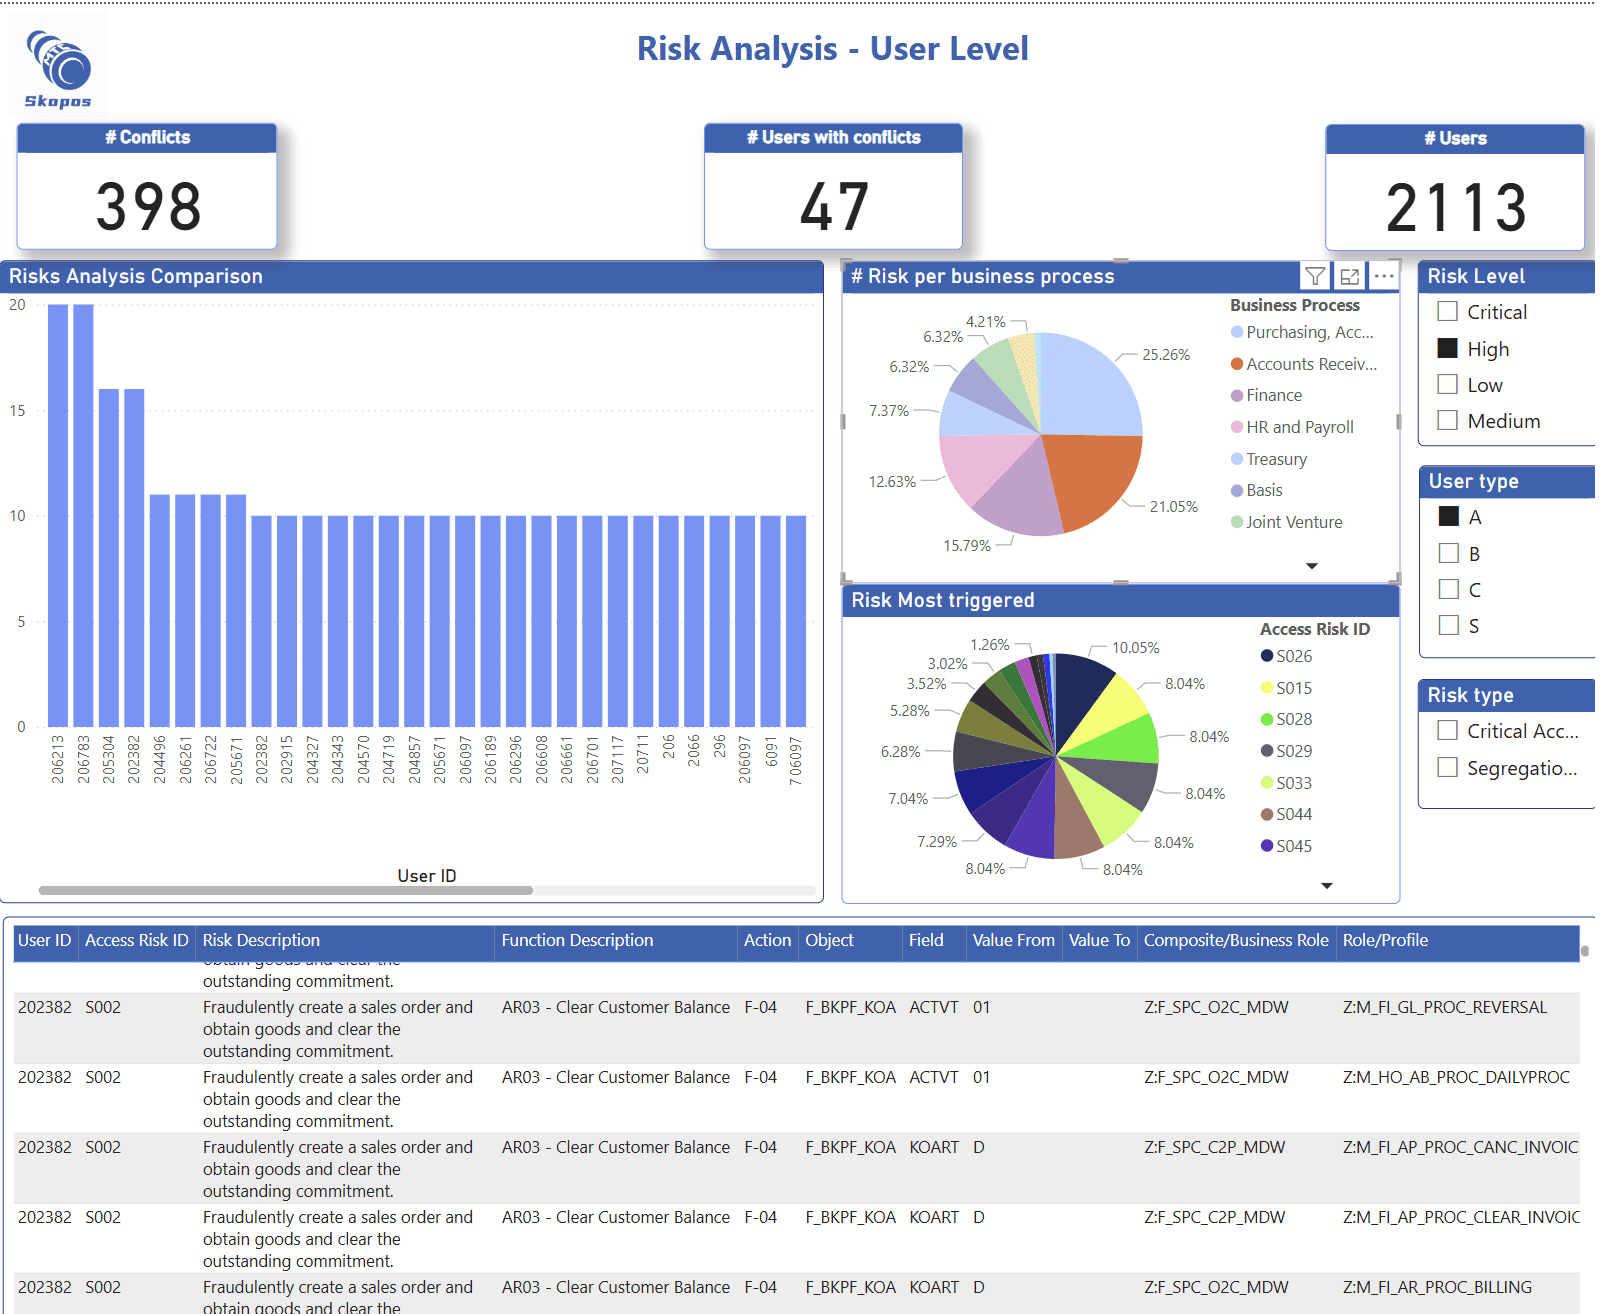
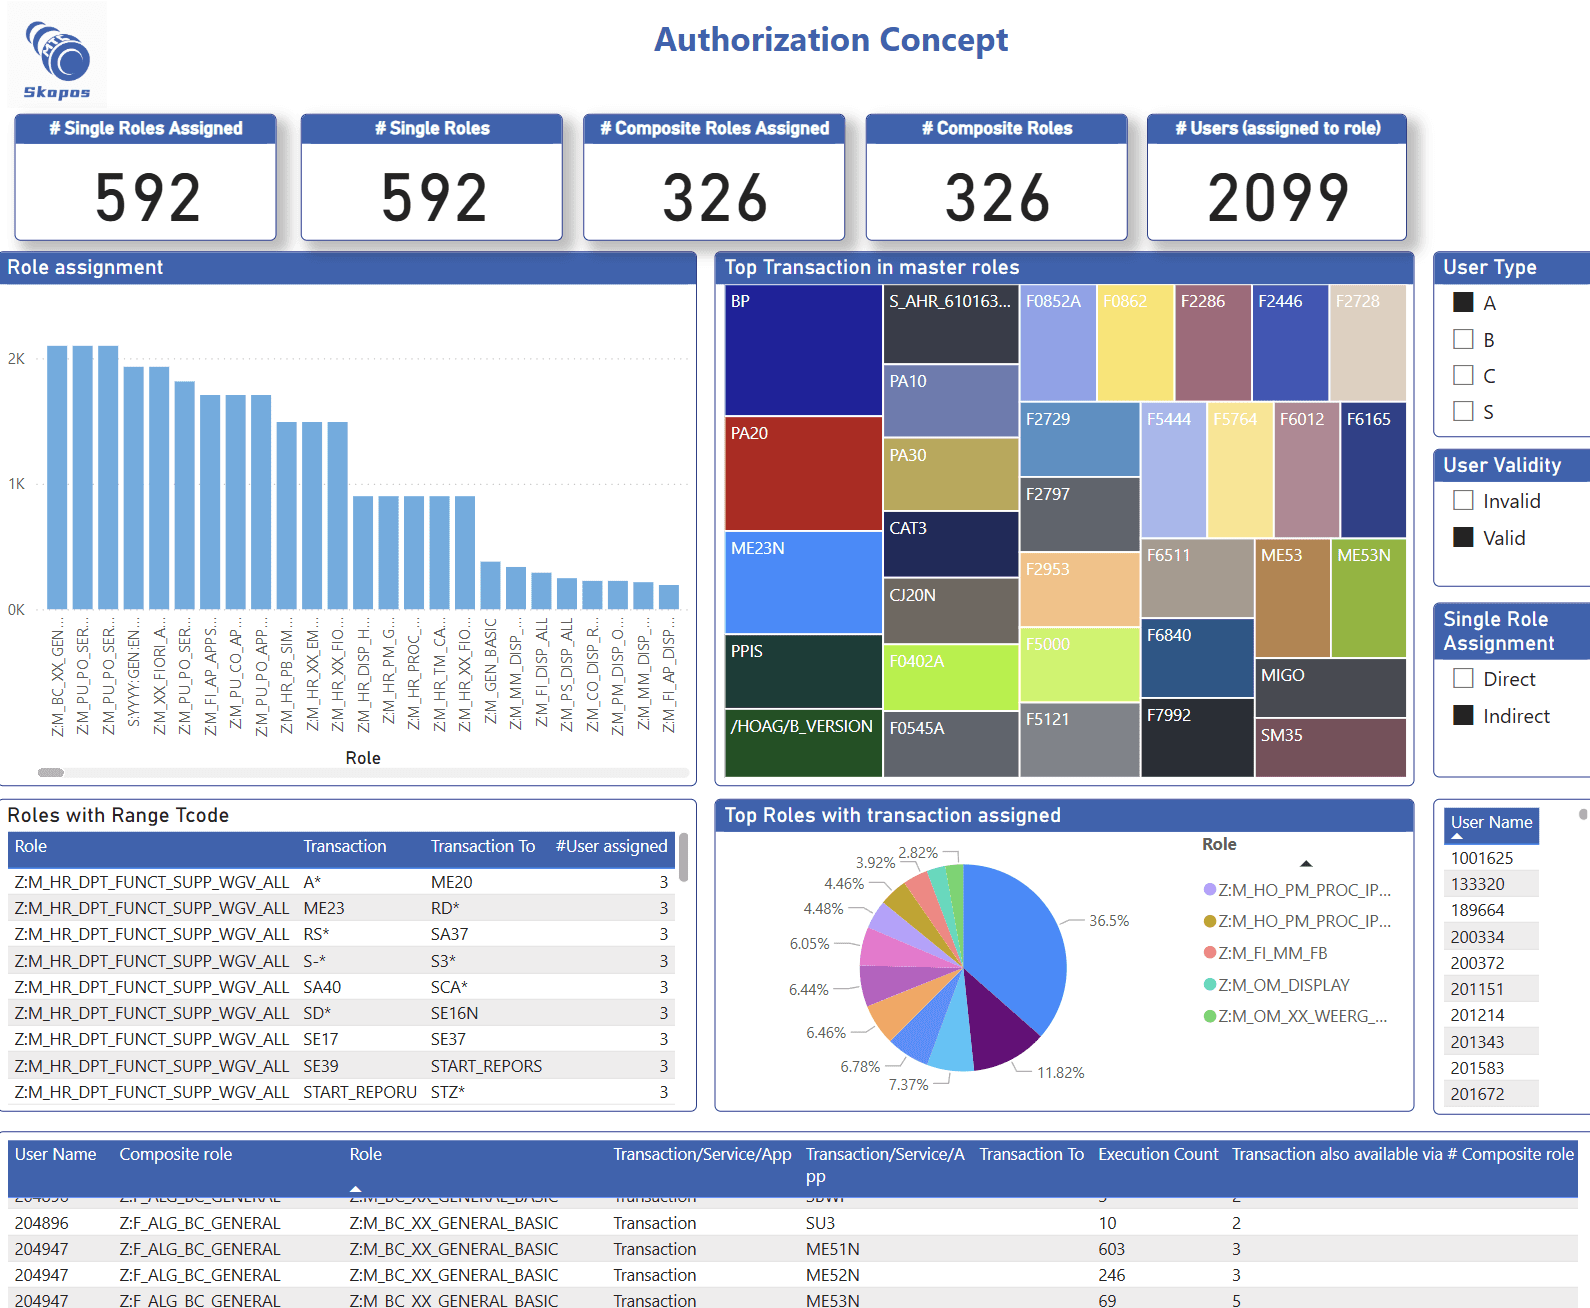
The Overview dashboard is the standard summary. When you need more than that, the export path is unchanged: MTC Skopos writes risk analysis results and authorization data in structured formats (CSV, JSON, Parquet) that import into Power BI, Tableau, or anything else that reads a table, and ships pre-built .pbix templates as a starting point.
Three things a .pbix buys you that a standard summary cannot:
- A report shaped by your risk appetite. Our data models come from years of security consulting and focus on access patterns that cause real problems, but only you know which company codes are material, which departments are under audit scrutiny, and which conflicts are already covered by a mitigating control. Start from the template, then cut it to fit.
- Your existing tooling. If your organization has already standardized on Power BI or Tableau, the risk data lands where your analysts and your refresh schedules already live.
- Ownership of the analytics. The data model is open. Modify the reports, add metrics, join them to other sources, or feed a warehouse. Access risk data does not become hostage to a subscription.
What we still are not
MTC Skopos is an access risk analysis specialist, not a GRC suite and not a BI platform. The Overview dashboard summarizes the run you just executed, and that is where it stops: no history across runs, no workflow or approvals, no report builder. Trending, custom views, and anything that combines access risk with data Skopos never sees belong in the .pbix or in your own BI platform.
We would rather ship a dashboard that is honest about its scope than a visualization layer that quietly becomes the reason you cannot leave.
Turning the report into action
- Prioritize what is real. Did-do evidence separates conflicts a user could exploit from conflicts a user actually exercised. Sort remediation by that, not by raw count. Start with a quick risk assessment to find where the exposure concentrates.
- Fix the roles, not the users. Most conflict volume traces back to a handful of over-broad roles. The drill-down from risk to function to action is the fastest path to identifying them, and advanced remediation proposes the role changes.
- Re-run and compare. Quarterly for full coverage, monthly for administrators, ad-hoc after any role catalog change.
Frequently asked questions
Does MTC Skopos have a built-in access risk dashboard?
Yes. Every analysis opens on an Overview dashboard showing total conflicts, users with a conflict, and users in scope, alongside conflicts broken down by risk level and by business process, the most triggered risks, and the users raising the most conflicts. Filters for risk level, risk type, and ruleset apply to the whole page, and clicking a risk drills into its functions and then into the individual actions behind it. It is the executive summary of the run, available without leaving the tool. For deeper dashboarding, MTC Skopos also ships a Power BI .pbix template and exports the full result set.
Can MTC Skopos generate access risk reports for Power BI?
Yes. MTC Skopos exports access risk analysis results and authorization data in structured formats (CSV, JSON, Parquet) ready for immediate import into Power BI, Tableau, or any BI platform. Pre-built Power BI dashboard templates (.pbix) are provided as a starting point, but the underlying data model is open, so you adapt the visualizations to match your organization's risk priorities rather than being locked into a vendor's default views.
What is the difference between an access risk report and an access risk analysis?
Access Risk Analysis (ARA) is the process of evaluating user permissions against a risk ruleset to identify violations. An access risk report is the documented output of that analysis, the artifact you share with auditors, management, and remediation teams. ARA is the engine; the report is the deliverable.
How often should you run an access risk report?
Run a full access risk report at least quarterly for SoD and critical access coverage to satisfy most audit cycles. High-risk users (administrators, users with firefighter-equivalent access) should be reviewed monthly. Run an ad-hoc access risk report whenever significant changes occur: new user onboarding waves, role catalog changes, system upgrades, or organizational restructuring. Continuous did-do analysis complements periodic reporting by flagging when dormant risks become active.
Related articles
- SAP Access Risk Analysis Tool - the analysis engine behind the report
- What is SoD (Segregation of Duties)?
- SoD Conflicts in SAP: 177+ Risks & Detection Guide
- Critical Access in SAP: Sensitive Transactions
- Did-Do Analysis: Real Risks, Not Theoretical
- Practical SAP Security: A Collaborative Approach
Ready to experience the difference? [Learn more about MTC Skopos] or [contact our team] to schedule a demonstration.